06/08/20
The Fed’s actions are a combination of lessons learned from the 2008 financial crisis and new measures created for today’s unique situation in their attempt to prevent the health and economic crisis from becoming a financial system crisis. Combined stimulus from the Fed, Congress, and the U.S. Treasury currently equals more than 25% of real U.S. GDP this year. It’s becoming easier to understand the concern about the current disconnect between the economic pain on Main Street and the resilience of Wall Street as the economic news continues to be rather devastating for Main Street, including U.S. deaths crossing over one hundred thousand and 40 million Americans filing for unemployment benefits.
Unprecedented Stimulus Has Helped Fuel Stock Rally
One reason for that resilience is that the growth rate in money supply that has gone parabolic (the blue line below) as the government has pumped liquidity into financial markets to keep the economy afloat. However, the velocity of money continues to decline (the yellow line below), which is why inflation in the “real economy” has not been an issue. “Money printing” by the Fed only becomes inflationary if the liquidity pumped into the financial system comes out via the lending channels and flows through the economy. Without increasing velocity, inflation may be absent in the real economy, but can become quite evident in financial assets, such as stocks, where prices can become inflated as a result.
M2 Money Supply Has Gone Parabolic As Velocity As Declined
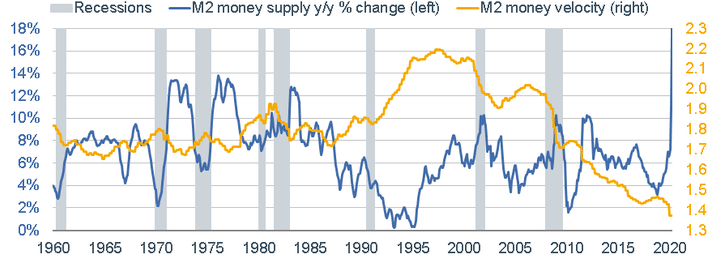
Source: Charles Schwab, Bloomberg, Federal Reserve as of 4/30/20
The government-mandated shutdown and resulting recession have broadly devastated earnings across companies and industries. FactSet recently reported that Q2 earnings estimates have come down 35% since March 31. To put in context for the full year, the current year 2020 earnings per share estimate for the S&P 500 has declined by 28% to $128 from $178. At the same time, stocks have broadly risen off the March lows based on the hope that the economy’s reopening will be successful, and also on expectation that we’ll develop therapeutics and eventually a vaccine for the virus itself. As an example, since mid-April, the four best-performing days for the Dow Jones Industrial Average, came on days there was a significant medical announcement:
- April 17: Gilead’s drug Remdesivir showed effectiveness in treating COVID-19 (+705 points)
- April 29: Positive data about Remdesivir’s trials (+532 points)
- May 18: Moderna announces early-stage human trials for its COVID-19 vaccine (+912 points)
- May 26: Novavax announces phase one clinical trial for vaccine; Merck announces plan to work on vaccine alongside IAVI (+530 points)
Stock Rally Has Left Us With Elevated Stock Valuations
With the recent stock market rally and declining corporate earnings continuing to filter through, stock valuations have increased significantly in just a matter of weeks. This has led us to become cautious on U.S. stocks and their return potential over the short term until we see improving economic data. It’s certainly true, fiscal and monetary support has been unprecedented and could ultimately overcome the damage to the economy, but getting 40 million Americans back to work and understanding what the recovery of several large industries, including travel & leisure, retail, and entertainment will look like are still largely unknown.
The below chart shows the S&P 500 Price to Earnings Ratios based on the Last Twelve Months (red line) and also Next Twelve Months (brown line). There is still much uncertainty to future earnings as many companies have pulled their guidance, but both show the rapid rise in valuations. Valuations have rebounded much faster than the economy. In focusing on the Next Twelve Months P/E ratio, it appears that investors are pricing in a ‘V’-shape recovery not only for the economy but also for earnings. However, we believe earnings estimates will continue to come down through the second quarter. We believe much of this rally has been fueled by the unprecedented stimulus provided by the Fed and Congress, which gives us reason for our short-term cautionary view on stocks until the economic data catches up.
S&P 500 P/E Ratios Have Significantly Risen In Recent Weeks
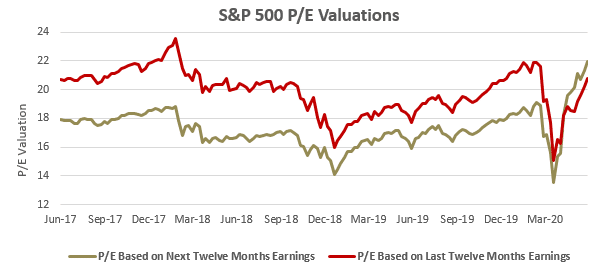
Source: Bloomberg, as of June 3, 2020 for trailing 3 years
Our strategy to navigate these uncertain times continues to be based on principles such as diversification across, and within, asset classes, and rebalancing that trims exposure into strength and adds exposure into weakness. We believe successful investing does not rely on the precise timing of market tops and bottoms, but is about a consistent process over time that reduces risks and keeps investors on track within their financial plans. Please contact a member of your client service team if you have any questions.
Disclosures: This is a general discussion of current investment themes, asset classes, and specific investment segments. The discussion includes our opinions and forward looking thoughts and analysis as of June 7, 2020 and is not a guarantee of future investment results. Actual client portfolios are often customized and do not necessarily represent an exact replication of, if any, allocation discussed. This commentary focuses on a wide range of economics and finance issues in order to educate you on the linkages between these topics and their impact on the overall economy and investment markets. The content of this presentation represents the opinions of Homrich Berg regarding these educational topics and should not be interpreted as direct investment advice or marketing of HB services. Information included is from sources believed to be reliable, but which have not been independently verified. Investing involves risks including loss of principal. This document does not constitute legal, tax accounting or investment advice.