There is a reason the mantra “run it hot” has become popular on investor wish lists for 2026. The “goldilocks” economy – not too hot, not too cold – prevails, but also suggests lower near-term equity market returns.
Our economic cycle model analyzes 4 indicators to assess the current state of U.S. growth, and it suggests that currently US activity levels remain slightly below what is typically experienced in expansion.
The strongest forward market returns are experienced when the economy is strained or operating at activity levels well below norms (“too cold”). This has been the model reading for most of the post-pandemic period.
Should the set of indicators manage to recover enough to push the model toward a resumed state of normal expansion activity levels, a slightly better environment for risk taking may emerge.
Goldilocks Economy Hints at a New Era of Mediocre Market Returns
The economy has re-entered goldilocks’ territory, but this is not particularly good news for equity investors hoping for a fourth straight year of remarkable returns. Historically, the best opportunities to increase exposure to risk occurred when the economy was strained, as was last the case in May 2025. With that opportunity now past and a renewed slump increasingly unlikely, the next stronger backdrop for risk-taking may emerge if the economy gathers enough momentum to break out of its current slow-growth regime and settle into expansion for the first time since 2021.
Economic Activity Level: Not Hot, Not Cold
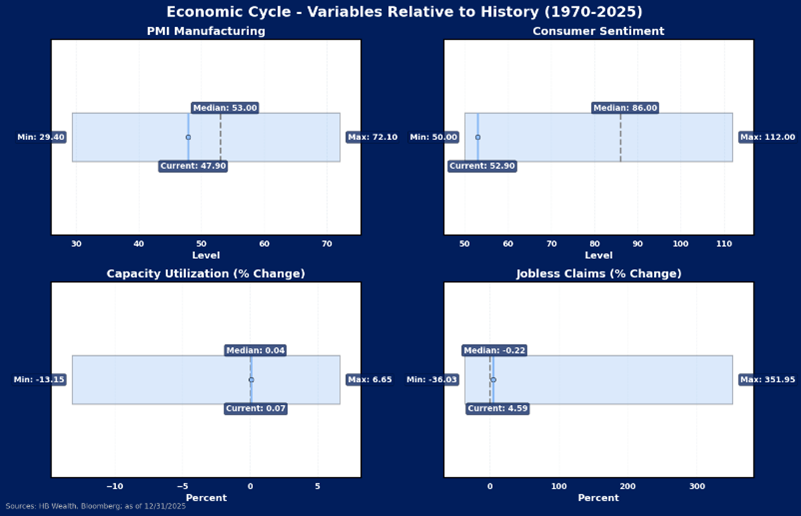
Our economic cycle model utilizes a combination of four indicators – continuing claims, consumer sentiment, capacity utilization and the ISM Manufacturing PMI – to guide us on the current state of the economy. The economic indicators are analyzed relative to their behavior in economic cycles dating back to the 1960s. Currently, the soft data is weakest, with consumer sentiment and manufacturing PMI both near levels normally affiliated with past recessions. Hard data is a bit stronger, but nothing to get excited about, with claims and capacity utilization near historical medians
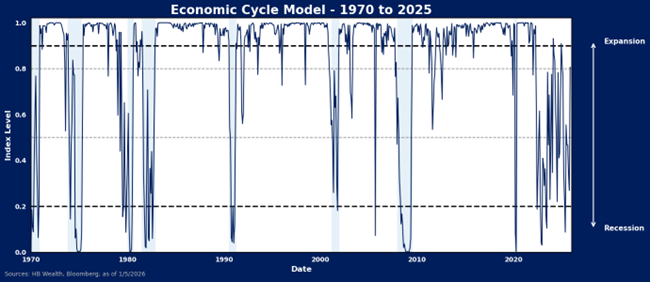
Taken together in a logistic regression form, this group of indicators can give us a probability of recession. The current reading of 0.8 from the logistical regression model output that ranges from 0 to 1 suggests that the economy is operating at a much stronger pace than is normal during recessions, but it is also not yet humming at a rate on par with the typical US economic expansion. In other words, while recession has not emerged, expansion also remains somewhat elusive. A reading below 0.2 on the activity scale is common in recessions historically. Expansions are affiliated with model readings above 0.9.
Goldilocks May Mean Lower, but Still Positive Returns for Stocks
The not too hot, nor too cold economy is not usually the strongest of the economic stages when it comes to equity market returns. Instead, it may imply stocks are set to settle into a slower pace of growth after the extreme surge that followed the most recent economic scare.
Over all cycles since 1970, the strongest 12-month forward returns for stocks on average occurred when the model suggested the economy was in a recession-like or very weak state (cold). The second strongest returns on average occurred when the economy was in full expansion mode (hot), and the weakest returns occurred when the economy was in between – not too hot, nor too cold.
Median returns show a similar pattern of strength amid economic weakness but decline in strength as economic activity improves.

The Economy has Run Cold Post-Pandemic
The “too cold” signal has been flashing abnormally frequently in the post-pandemic environment, which may help explain why stocks have managed three straight years of very strong returns. Our cycle model hailed recession-like conditions (below 0.2) in October 2022, June 2023 and May 2025. As the economy recovered from these lows, twelve month returns after each of those points were 8.3%, 22.7% while stocks are up 15.8% since May. Since 1969, 12-month equity market returns after the model fell below 0.2 averaged more than 16%.
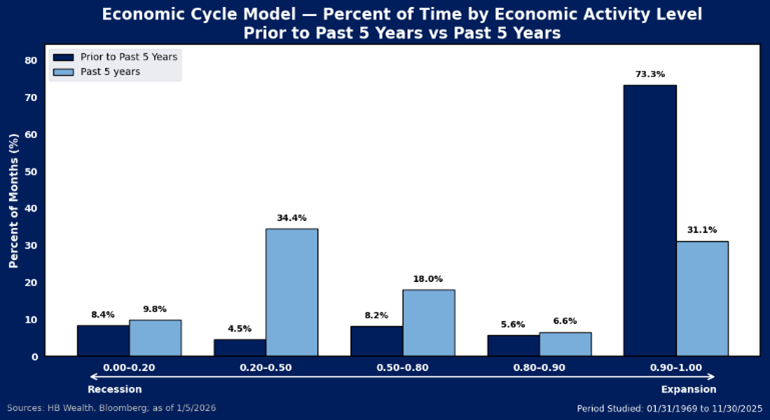
The cycle model also suggests the economy has failed to recover into a sustained cyclical expansion (above 0.90 on the logistical regression model) since 2022’s inflation-induced slump. Though no official recession was declared, an official “lift off” into economic expansion was also not achieved. Instead, the U.S. economy has spent an abnormal amount of time (nearly 50% of the last five years) operating at a below average activity level, flirting with cues typical of former recessions several times.
These unusual model readings are confirmed by this cycle’s oddities, such as the continuous rise in unemployment and persistent weakness in broader leading economic indicators, which conflict with pre-crisis norms during economic expansions.
Conclusion
As the economic signal improved from its low in May 2025, stocks surged in line with the model’s expectations. However, with most of that recovery now in the past, returns may slow. The current indication from the economic cycle model is 0.80, still shy of full expansion, and a level of activity that is historically infrequent, but affiliated with positive, below average returns. If U.S. economy bursts out of its post-pandemic malaise into a sustained expansion, this could offer a slightly better environment for risk taking. This is certainly possible should inflation pressures and job strains both ease significantly in the year ahead. For now, goldilocks prevails and she suggests we should lower our expectations for near-term equity market returns.
Disclosure: The information reflects the author’s views, opinions, and analyses as the publication date. The information is provided for informational purposes only and does not constitute an offer to sell or a solicitation of an offer to buy any investment product. This information contains forward-looking statements, predictions, and forecasts (“forward-looking statements”) concerning the belief and opinions in respect to the future. Forward-looking statements involve risks and uncertainties, and undue reliance should not be placed on them. There can be no assurance that forward-looking statements will prove to be accurate, and actual results and future events could differ materially from those anticipated in such statements. The information does not represent legal, tax, accounting, or investment advice; recipients should consult their respective advisors regarding such matters. Certain information herein is based on third-party sources believed to be reliable, but which have not been independently verified. Past performance is not a guarantee or indicator of future results; inherent in any investment is the risk of loss.