HB Perspective on The Yield Curve

Line graph titled Treasury Yield Curve showing treasury yields on the y-axis and maturities on the x-axis, ranging from 3 months to 30 years. The graph curves upward, with a red circle highlighting an inversion around the 2 to 5-year range.

By: Ross Bramwell

The topic of a yield curve inversion has been at the forefront of financial news this week and we wanted to share our thoughts. As highlighted in our October e-mail to clients, we have seen significant volatility in both stocks and bonds over the course of the past several months. This has been driven by a variety of factors including the U.S./China trade war, signs of economic slowdown in some foreign countries, and even some leading signs of a potential slowdown here in the U.S. As a result, we have seen the Fed indicate an unexpected change in course recently when Fed Chairman Powell suggested that we are “near neutral interest rates.” This would be a dramatic shift from previous comments that suggested the Fed was planning on raising interest rates several times between now and the end of 2019.

Following the recent statements, the upward trend in longer-term interest rates reversed, and we have seen a significant decline in the 10-year Treasury rate. This week many news outlets are covering the fact that a few points on the yield curve have “inverted.”

Typically, long-term rates are higher than short-term rates because the market expects future economic growth. The yield curve has inverted when shorter-term rates are actually higher than longer-term rates, meaning a slowdown is expected. A yield curve inversion is often seen as a sign of a pending recession, so it stands to reason that the media would make the most of a headline when we have our first yield curve inversion since the financial crisis.

Line graph titled Treasury Yield Curve showing treasury yields on the y-axis and maturities on the x-axis, ranging from 3 months to 30 years. The graph curves upward, with a red circle highlighting an inversion around the 2 to 5-year range.


However, we want to point out a few key things to remember about a yield curve inversion as this phenomenon will probably continue to make headlines through 2019:

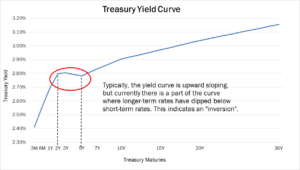
• The part of the yield curve that is currently inverted is the area between the 2- and 3-year Treasuries with the 5-year Treasury, as the 5-year Treasury is now yielding slightly lower than the 2- and 3-year Treasuries (see chart above).

• An inverted yield curve is an often watched recession indicator, but the most common indicator on the yield curve is the 2-year Treasury yield with the 10-year Treasury yield, which is currently not inverted.

• Prior recessions have been preceded by an inversion of the 2-year and 10-year Treasury yields, but the recession has been on average 18-24 months after the inversion occurred (see the chart below).

Line graph showing the spread between U.S. 10-year and 2-year yields from 1995 to 2016. Notable features include curve inversions around 2000 and 2006, rate hiking cycles, and shaded recessions during 2001 and 2008-2009. Data by J.P. Morgan.


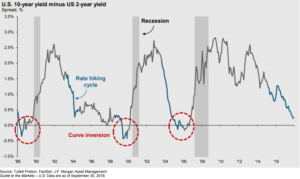
There have been false positives as well with inversions at certain points of the yield curve so it is not a perfect indicator. We will continue to monitor the underlying economic data. While the current changes are definitely worth noting, we do not believe it should create any knee-jerk reactions in our investment allocations as we do not see the current inversion as a sign of a pending recession.

If you have any further questions please reach out to a member of your service team.


Disclosures: The following includes our opinions and forward looking thoughts and analysis as of December 4, 2018 and are not a guarantee of future investment results. This presentation includes third party sources which we believe are reliable but have not been independently verified. This is not an offer to buy or sell securities and is for informational purposes only.

HB Wealth is a national independent wealth management firm providing fiduciary, fee-only wealth advisory services, investment management, and family office services, with a mission of bringing unwavering financial peace of mind to the clients we are privileged to serve. 

Related Insights & News

White text reading HB Wealth on a solid dark blue background.

Homrich Berg Unveils HB Wealth as New Name, Aligning Under Unified Brand

$25B RIA’s rebranding reflects national scale and client-centered focus ATLANTA, GA — August 19, 2025…

Read More

Text graphic with four black brushstroke squares, each containing different business types: Sole Proprietorships, Partnerships, LLC, and Corporations.

Evaluating Business Structures: The Pros And Cons

Family businesses often start small with simple business and tax structures. However, as businesses expand,…

Read More

Image featuring a financial theme. Text reads, Interest rates are still a key driver of stock market returns. Includes a circular photo of a smiling man labeled Ross Bramwell, CFA, Principal above the Homrich Berg Wealth Management logo.

Interest Rates Are Still a Key Driver Of Stock Market Returns

The Federal Reserve once again kept its key rate unchanged at its June 12th meeting….

Read More

A field of white daisies against a blue sky, with a hiker in the background holding trekking poles, blurred by depth of field.

Spring Towards Your Financial Goals

Spring is my favorite time of the year. The gloom and cold of winter rains…

Read More

The above is not a recommendation to purchase or sell a particular security and is not legal, investment or tax advice. Results are not guaranteed. All investing involves risk.

Past performance is not a guarantee of future results for any investment. Private alternative investments are not for every client. An individual must be qualified to invest in a private investment based on their net worth and/or other criteria, and they may qualify to invest in some alternative investments while not being allowed to invest in other alternative investments. Alternative investments are not risk-free and there is no guarantee of achieving attractive performance compared to similar liquid investments. Risks associated with investments in private alternatives include the illiquid nature of such investments, risks associated with leveraged investments, manager-specific risks, sector-specific risks, and in certain cases geographical risk, as well as the risk of loss of principal.